It’s a waste of time to call Comcast. You probably won’t get any discounts for your loyalty. These days, even threatening to cancel while on the line with one of their “retention specialists” may not get you a deal, and if it does, it’s unlikely to be a good one. Besides, phone calls to Comcast often take forever, and you have better things to do with your time.
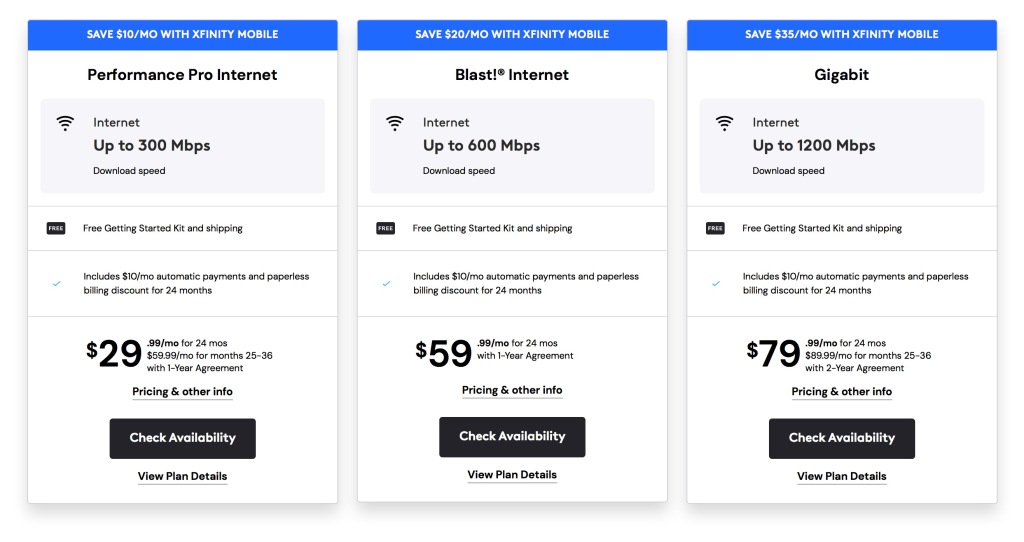
If you want a good deal, you need a new customer special. One of these:
Just go to xfinity.com, sign up as a new customer using your roommate’s/spouse’s name (or maybe your dog or alias idk), skip past all of the other stuff they want you to sign up for, and that’s all. Comcast will automatically put in a cancellation for the existing account at your address and email them to that effect. You then just download the Xfinity app on your phone, go through the activation process (put in the MAC number on your router), and you’ll have internet access in about 5 minutes.
Do this once a year or whenever your “New Customer” pricing runs out. Simple, and no phone call involved.
You can go back-and-forth between your name and whoever you live with multiple times (see this Reddit post).
I’m mid-clerkship, and here’s what I found helpful so far:
Podcasts.
Pediatric Emergency Playbook. PEMPlaybook.org Your best bet. This is a great podcast by UCLA-based Tim Horeczko, MD. He digs into topics for about 1 h at a time. It’s pretty engaging, and brings in cases, the latest research, and lots of clinical pearls. Many of the topics are high-yield, such as diarrhea, syndromes, otitis media, and strep throat.
Peds in a Pod. This one is by a few fun residents and some attendings. They are making it to review for the pediatrics boards. The episodes vary in length and quality, and are generally pretty good.
Peds Cases. More variable in quality. PedsCases.com. Mostly pretty short.
Books
I’m using BRS Pediatrics as more of a textbook, and I like Pre-Test Pediatrics and Case Files: Pediatrics for lots of questions and for cases followed by questions, respectively.
Special things to bring with you
I clipped a little stuffed animal penguin on my stethoscope. Kids like it and parents think it’s cute.
Stickers are good to stash in your white coat.
As always, stock up on alcohol swabs, and always have a trusty penlight, lots of pens, highlighter, stethoscope, and maybe even a tuning fork. I like a White Coat Clipboard and/or small legal pad too.
I also snagged one of these $2 cards to go on a badge reel with normal vital sign ranges for the various age groups you will see and developmental milestones (can find on eBay, Amazon, etc):
Do you have a big frosty box of Eppendorf tubes where you can’t read the tops? Rubbing of the frost not working?
I found that quickly blowing the tops with a heat gun does the trick, while barely warming up the samples.
You can always get a cheap-o heat gun like this one from Home Depot rather than paying hundreds for a “science” heat gun from a scientific supplier, but it probably will die on you sooner. A hairdryer can work in a pinch.
Note: the following contains affiliate links that do not affect the price you pay, but may provide a small commission to help support this blog.
Case Files: Obstetrics & Gynecology was pivotal in my preparation! The cases are high-yield with good explanations and generally pretty good questions.
I liked SOAP for Obstetrics and Gynecologyfor the wards. It’s a handy reference that tells you the questions to ask, physical exam findings, and how to construct an assessment and plan for ~100 different common conditions.
ACOG Practice Bulletins are good sources to read up on specific topics for the wards.
Q-banks: UWorld, UWise (APGO’s Q-bank, provided to students by many med schools)
Podcasts/Videos
The best podcast is Dr. Tonya Wright’s The OBG Med Student (Apple). Dr. Wright is the clerkship director at Penn State’s med school, and she recorded twenty-six 10-20 minute episodes with residents and faculty members from Penn State Hershey Medical Center. Each episode uses a great case-based Q&A back-and-forth format that is interesting and engaging. This podcast is specifically focused on APGO learning objectives that are frequently tested on the SHELF exam. It is specifically made for med students. Give it a listen!
Online MedEd is well-received, but I didn’t use it much.
APGO (Association of Professors of Gynecology and Obstetrics) has produced a library of over 50 short (5-10 min) animated YouTube videos about high-yield medical student learning objectives. They’re pretty engaging and well done. Fire up Brave Browser (so you don’t have to watch ads and can earn some crypto) and tune in: https://www.youtube.com/playlist?list=PLy35JKgvOASnHHXni4mjXX9kwVA_YMDpq
The OB/Gyn Podcast is a bit too long-winded and historical in my opinion, but might be good if you have a long car ride and want something to listen to: http://www.obgyn.fm/.
Mnemonics/Concepts
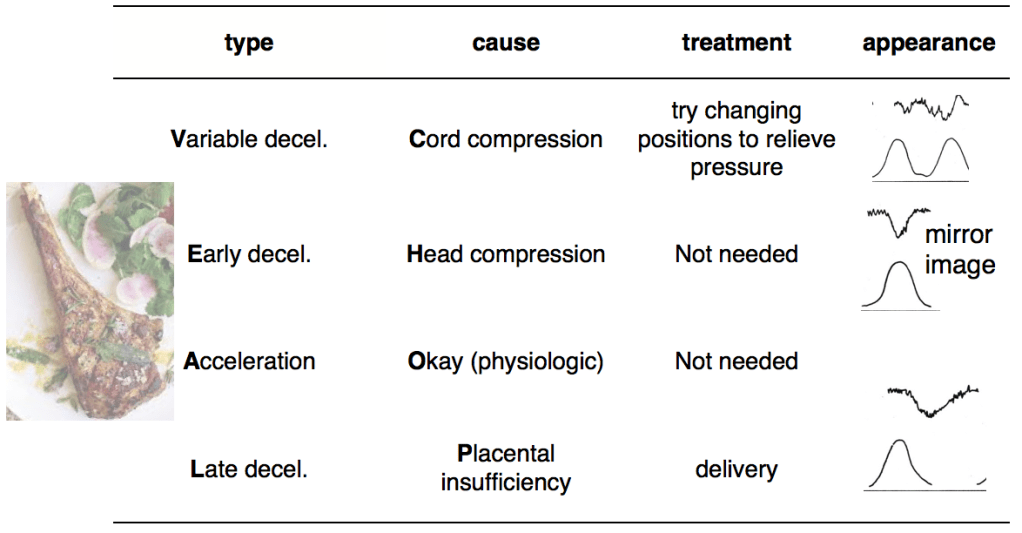
“VEAL CHOP” was a good way to remember fetal heart tracings. This is part of fetal heart monitoring to measure fetal distress. You look at the fetal heart rate (top trace) and uterine pressure (bottom) in these traces.
One of my attendings broke down hypertension in pregnancy like this:
Lastly, for maternal-fetal physiology, remember:
Most stuff goes up like 30%
Everything goes up even more if there are twins, triplets, etc (multiple gestation)
Blood plasma volume goes up even more than Hgb, often leading to a dilutional anemia picture (even though the total RBC mass is up).
Skills to know/learn
OR: know how to:
Get your gloves up, scrub, get bed in/out of room at beginning/end of case, help roll patient to/from bed to table
Skills:
putting in/taking out Foley catheter,
suturing,
knot-tying
generally two-hand or one-hand; instrument tying isn’t as common.
The French knot is used to close large skin incisions (e.g., after C-sections), which is able to be buried under the skin, but you probably won’t be expected to learn that one even though it’s easy.
Nice, concise history
All OB patients should be asked the four questions — vaginal bleeding, loss of fluids, contractions, and have you felt the baby move? (note quickening is ~20 wks for primigravida and a few weeks earlier for multips).
Shimadzu LabSolutions Postrun software isn’t always the easiest to use, and the funky translations from the Japanese version don’t help. After a few years using it, I’m sharing what I’ve learned in a quick guide to some of the most important and commonly-used functions for any analyst.
1. Extracted Ion Chromatograms (EICs)
Often, you’ll want to get a trace of when a specific ion’s m/z is seen over time. Basically, you’ll want to extract a chromatogram (signal over time) for a specific ion from all the data. This is in contrast to a Total Ion Chromatogram (TIC), which sums up the total number of counts for all ions with any m/z, and displays it over time. The TIC lets you know when there’s a peak, but it can be misleading if you’re using a dirty column, have impurities from the vials/septa/mobile phases that fly well, etc, and it may obscure small peaks that you are interested in if they are low abundance or don’t ionize well.
Under MS Data, just click “Data View Parameters” in the top left of the sidebar. From there, just type in the desired m/z values. “Event” refers to the polarity — for positive mode, it’s “1” on our system, and “2” for negative. Feel free to get a bunch of EICs for everything you’re interested in using either polarity, and look for many adducts like [M+H]+, [M+Na]+, etc.
If you have many samples you analyzed, select the rows of the MS Data View Parameters window, copy (ctrl-C), and you can paste them into the MS Data View Parameters window of your other data files.
EICs will be displayed below the TICs in the Chromatogram View. If you save the data file, they’ll still be there when you reopen it (i.e., it saves your “MS Data View Parameters” settings).
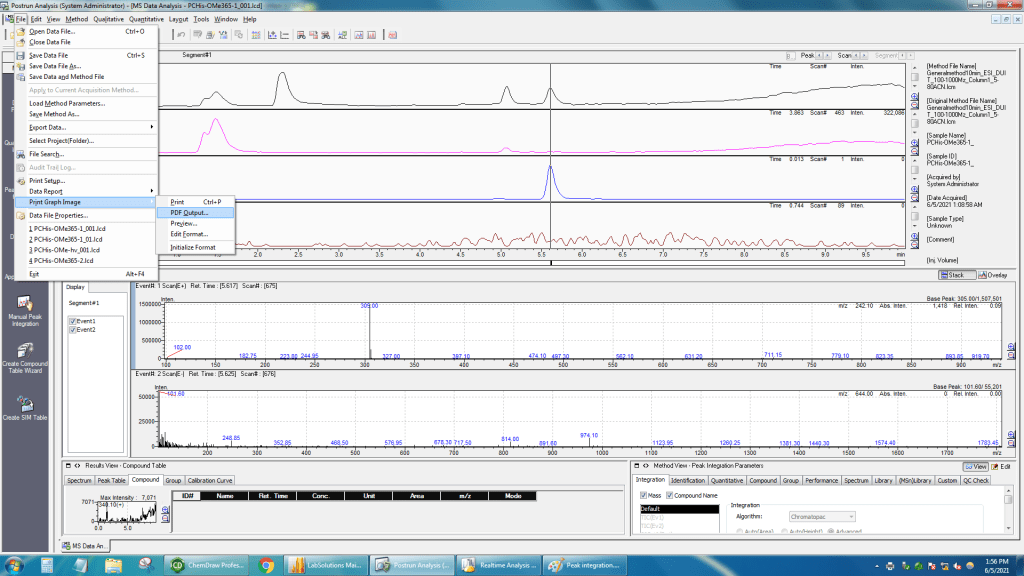
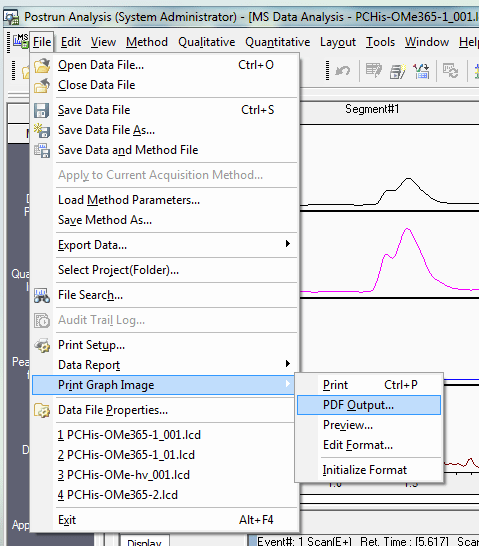
2. Quick data export with TICs, EICs with peak heights, and mass spectra
LabSolutions has a powerful (yet clunky) report editor that lets you generate whatever report you want, complete with chromatograms, mass spectra, methods info, annotations, etc. However, often you just want to get a quick export of chromatograms and a mass spectrum if you’re just characterizing a compound. For an LC-MS analysis, you may also want some EICs and peak heights (areas are harder — see next section). To get this done without having to click around in the report editor, you simply use the “Print Graph Image” command. This can quickly export a PDF that will have the chromatograms you have displayed, and the mass spectra you have up (one positive, one negative). The mass spectra will be from the positive and negative scans taken at the time where the vertical line is positioned on the chromatograms (controlled by double-clicking, or clicking the Scan < or > buttons.
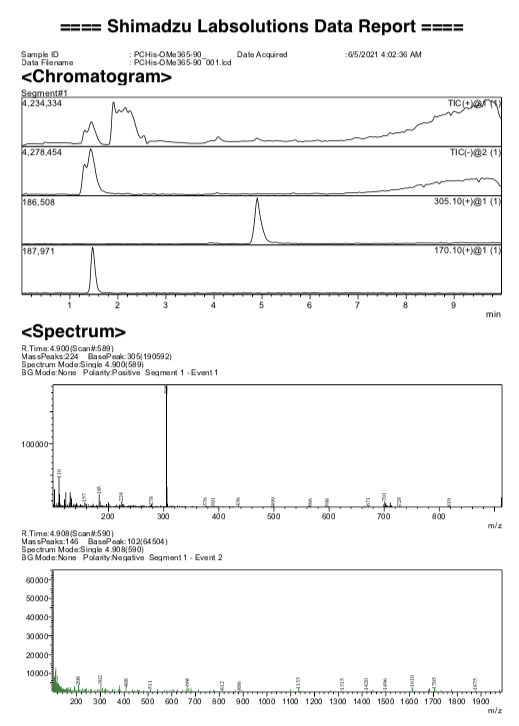
Here’s an example report that it’ll generate and let you Save As with a single click. Note that it gives a peak height for each EIC. Peak height should be fine for quantification, though it is not considered as sensitive as integrating the peak area (see part 3).
If you use the actual report editor, you can customize everything more. Some key options in this editor to know about are that when you double-click on a mass spectrum:
“Not thin out” check box and threshold (relative abundance in % I think) lets you label more peaks. Often 6-7% is a good threshold.
Feel free to customize the fonts and angles.
You can select the m/z range to zoom in peaks of interest, and pick the rt when you want to show spectra.
3. Peak area
Integrating peak areas in LabSolutions is possible, but pretty clunky. However, it can give you more sensitivity than peak height for quantitative analysis.
Here’s how to do it:
In the bottom right (Method View), go into the compound table and type the name and m/z for the compound(s) of interest
2. Click the “integration” tab. I think you have to pick the compound you want, then move to the area to the left (Results View), click the “Compound” tab, and right-click to perform “Peak integration for All IDs”
3. You can also try the “Peak Table” tab on the left and toggling back-and-forth between “View” and “Edit” on the far right, and possibly changing peak width in the settings in the “integration” tab. But be sure you are using consistent integration parameters for all samples.
Once you have your data, I think you have to copy/paste or type it into its final destination (spreadsheet, etc).
YetiCold or YetiWallet is a great way to store your bitcoin on your own. There is a great video walkthrough about how to do the wallet creation, and the instructions within Yeti guide you through this process pretty clearly. However, after that, you’re instructed to erase your entire machine, and it’s up to you to get your wallet back afterwards! I was a little nervous about doing this, and didn’t want to start sending coins to this wallet until I could be sure I knew how to get the wallet back after wiping the machine. So I decided to test it. I deleted my wallet, and tried recovering it.
This is how to get your wallet back using 3 of your 7 seeds. It also has a bit more explanation about how the 3 of 7 multisig wallet is set up, how wallet files work in Bitcoin Core, and what all the text at the bottom of each seed file is.
Bitcoin core keeps your wallet in a file called Wallet.dat in the hidden .bitcoin folder in your home directory. This wallet file has to be present for you to use your wallet and spend your coins. While it is gone (i.e., after you wipe your machine), you can still receive coins at a previous address generated with the wallet. The blockchain will remember that those coins are there for you. But what happens when you want to regenerate/recover the wallet so you can spend them?
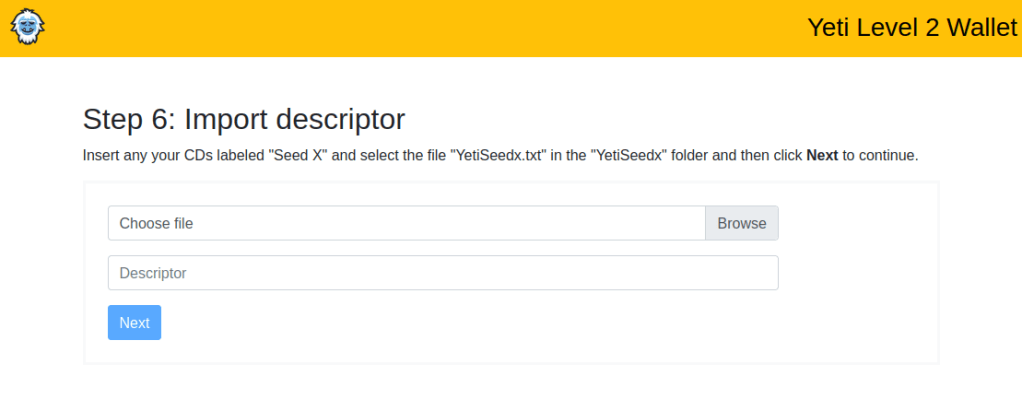
Remember that YetiCold generates your seven seeds, and an additional file called “Descriptor.txt.” Descriptor.txt contains a very long string of letters and numbers that explains how all the seeds fit together so that 3 of the 7 can be used to regernate the wallet. This string from Descriptor.txt is copied at the end of each seed. So that way, each seed carries the instructions about how it fits together with the other seeds. Basically, to recover a wallet, you just load up a seed into YetiCold so it can pull the descriptor out of it. Then, you load up three seeds in succession. It will then rescan for a few minutes, and you’ll then have your wallet back. Here’s how it’s done:
Run YetiCold. This can be accomplished by opening Terminal, and running the following commands to enter the directory where YetiCold is stored, then starting it using Python3 to run initialize.py, specifically with the YetiLevelTwo version:
cd yeticold
python3 initialize.py YetiLevelTwo
YetiCold will open. From here, you just need to go to “Recover Wallet.”
You now need to download the blockchain and have your computer validate it. This will take at least overnight (with an SSD), and may take several days (with an HDD). YetiCold will wait around until this is complete. You can do this ahead-of-time so it’s ready without compromising security.
Next, Yeti will ask you to load up a seed (any seed!) so it can pull the descriptor. Just browse for the file (on your CD, or copied onto a device — careful!)
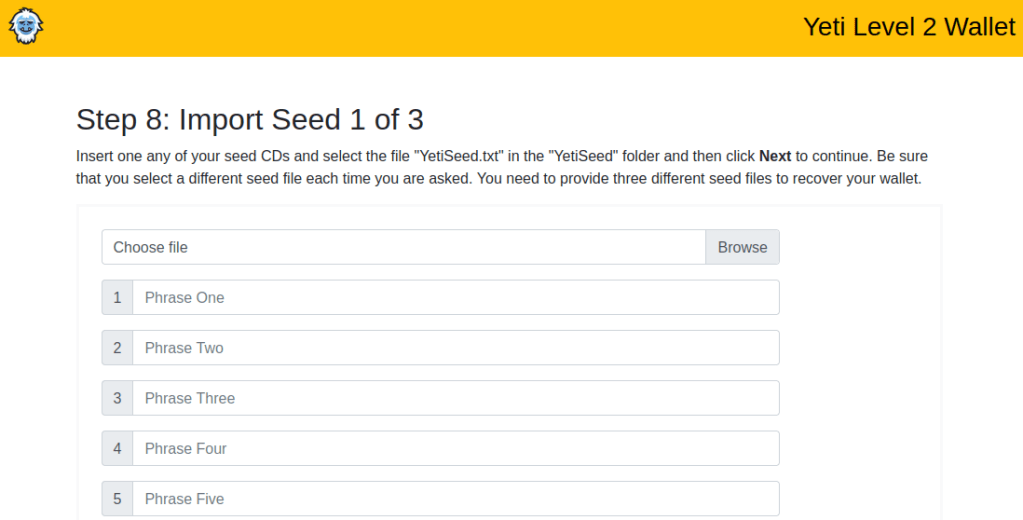
Finally, you’ll have to import any 3 of your seven seeds similarly. Put each CD in and browse to it and it’ll load them up. Each phrase will turn green once it’s validated.
After that, you’ll hit next. It’ll rescan for a few minutes, and then you’ll have your wallet recovered. If your blockchain is synced, it’ll know what your balance is (with all the coins received).