Shimadzu LabSolutions Postrun software isn’t always the easiest to use, and the funky translations from the Japanese version don’t help. After a few years using it, I’m sharing what I’ve learned in a quick guide to some of the most important and commonly-used functions for any analyst.
1. Extracted Ion Chromatograms (EICs)
Often, you’ll want to get a trace of when a specific ion’s m/z is seen over time. Basically, you’ll want to extract a chromatogram (signal over time) for a specific ion from all the data. This is in contrast to a Total Ion Chromatogram (TIC), which sums up the total number of counts for all ions with any m/z, and displays it over time. The TIC lets you know when there’s a peak, but it can be misleading if you’re using a dirty column, have impurities from the vials/septa/mobile phases that fly well, etc, and it may obscure small peaks that you are interested in if they are low abundance or don’t ionize well.
Under MS Data, just click “Data View Parameters” in the top left of the sidebar. From there, just type in the desired m/z values. “Event” refers to the polarity — for positive mode, it’s “1” on our system, and “2” for negative. Feel free to get a bunch of EICs for everything you’re interested in using either polarity, and look for many adducts like [M+H]+, [M+Na]+, etc.
If you have many samples you analyzed, select the rows of the MS Data View Parameters window, copy (ctrl-C), and you can paste them into the MS Data View Parameters window of your other data files.
EICs will be displayed below the TICs in the Chromatogram View. If you save the data file, they’ll still be there when you reopen it (i.e., it saves your “MS Data View Parameters” settings).


2. Quick data export with TICs, EICs with peak heights, and mass spectra
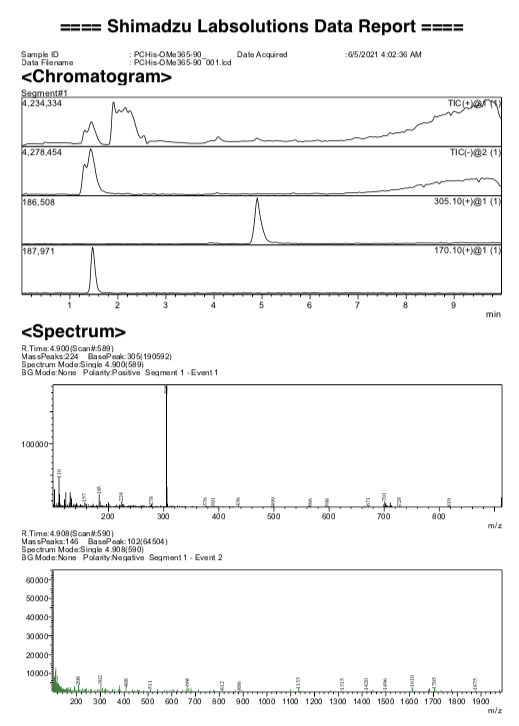
LabSolutions has a powerful (yet clunky) report editor that lets you generate whatever report you want, complete with chromatograms, mass spectra, methods info, annotations, etc. However, often you just want to get a quick export of chromatograms and a mass spectrum if you’re just characterizing a compound. For an LC-MS analysis, you may also want some EICs and peak heights (areas are harder — see next section). To get this done without having to click around in the report editor, you simply use the “Print Graph Image” command. This can quickly export a PDF that will have the chromatograms you have displayed, and the mass spectra you have up (one positive, one negative). The mass spectra will be from the positive and negative scans taken at the time where the vertical line is positioned on the chromatograms (controlled by double-clicking, or clicking the Scan < or > buttons.
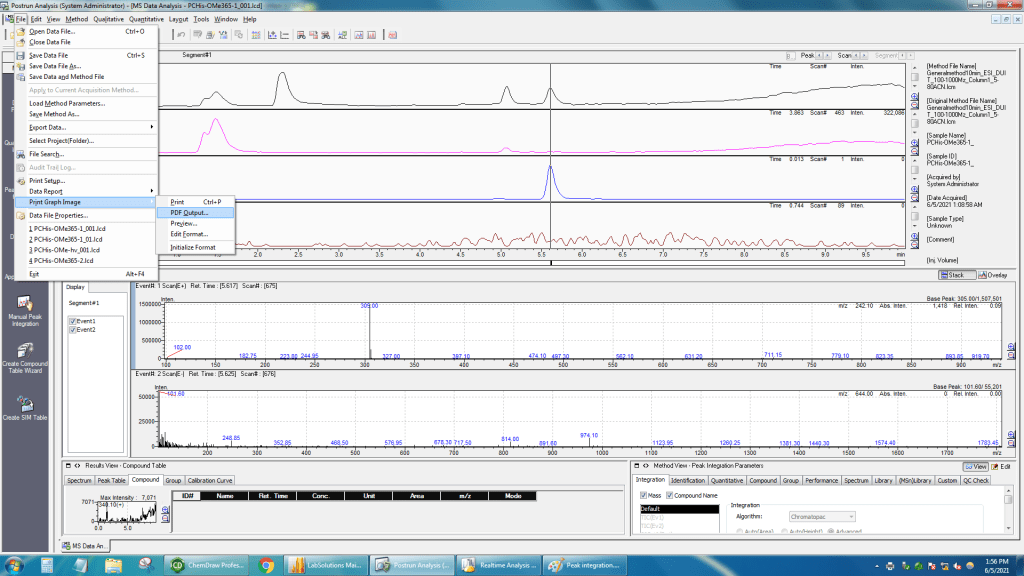
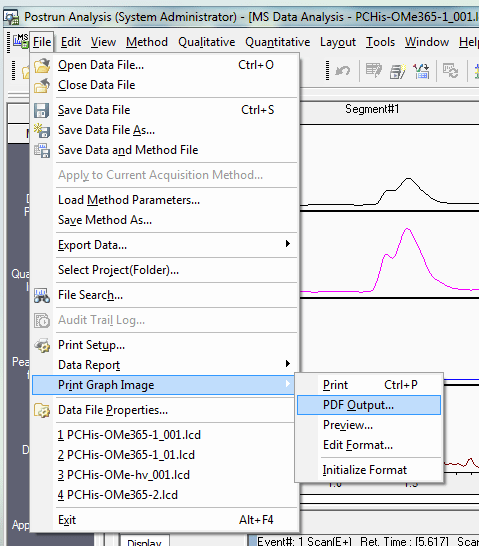
Here’s an example report that it’ll generate and let you Save As with a single click. Note that it gives a peak height for each EIC. Peak height should be fine for quantification, though it is not considered as sensitive as integrating the peak area (see part 3).
If you use the actual report editor, you can customize everything more. Some key options in this editor to know about are that when you double-click on a mass spectrum:
- “Not thin out” check box and threshold (relative abundance in % I think) lets you label more peaks. Often 6-7% is a good threshold.
- Feel free to customize the fonts and angles.
- You can select the m/z range to zoom in peaks of interest, and pick the rt when you want to show spectra.
3. Peak area
Integrating peak areas in LabSolutions is possible, but pretty clunky. However, it can give you more sensitivity than peak height for quantitative analysis.
Here’s how to do it:
- In the bottom right (Method View), go into the compound table and type the name and m/z for the compound(s) of interest


2. Click the “integration” tab. I think you have to pick the compound you want, then move to the area to the left (Results View), click the “Compound” tab, and right-click to perform “Peak integration for All IDs”


3. You can also try the “Peak Table” tab on the left and toggling back-and-forth between “View” and “Edit” on the far right, and possibly changing peak width in the settings in the “integration” tab. But be sure you are using consistent integration parameters for all samples.


Once you have your data, I think you have to copy/paste or type it into its final destination (spreadsheet, etc).
I hope these tips help you in your research!
